Industrial platform in real time
Operational intelligence in real time.
KappaForge measures every process in your operation and turns it into the numbers you operate, decide and bill on. It runs on AI models built for industrial processes.
It comes two ways: end to end with the instrumentation included, or the software alone if your PLCs and sensors are already in place.
The platform
All of it over the same data.
One solution, with no loose suppliers to coordinate. What gets measured, calculated and displayed comes from the same place, so the number on the dashboard and the number on the invoice agree.
Acquisition and instrumentation
Sensors, PLCs and the link back to the platform. We can deliver it installed and running, or connect to the instrumentation you already have.
Real time
Everything that arrives is processed as it arrives. Dashboards update on their own, with no refresh and no waiting for the shift report.
Metrics and aggregation
Raw readings become the numbers the business actually uses: conversions, totals by period and multi-step calculations. Every metric shows the formula behind it.
Equipment modeling
Built on our own industrial ontology: the skid, the lines and the machines are loaded in with their sensors and units. Adding equipment is configuration, not development.
Operating ranges
They learn how each machine normally moves and flag the drift when a signal leaves that band.
Forecasting and root cause
They anticipate a target that will be missed or a failure before the signal reaches its limit, and reconstruct where an event started.
In operation
An LNG plant and a cuttings transport skid.
Two different operations on the same platform. The dashboards below run on their real signals: plant layout and production for the first, delivered volume and pump condition for the second.
01
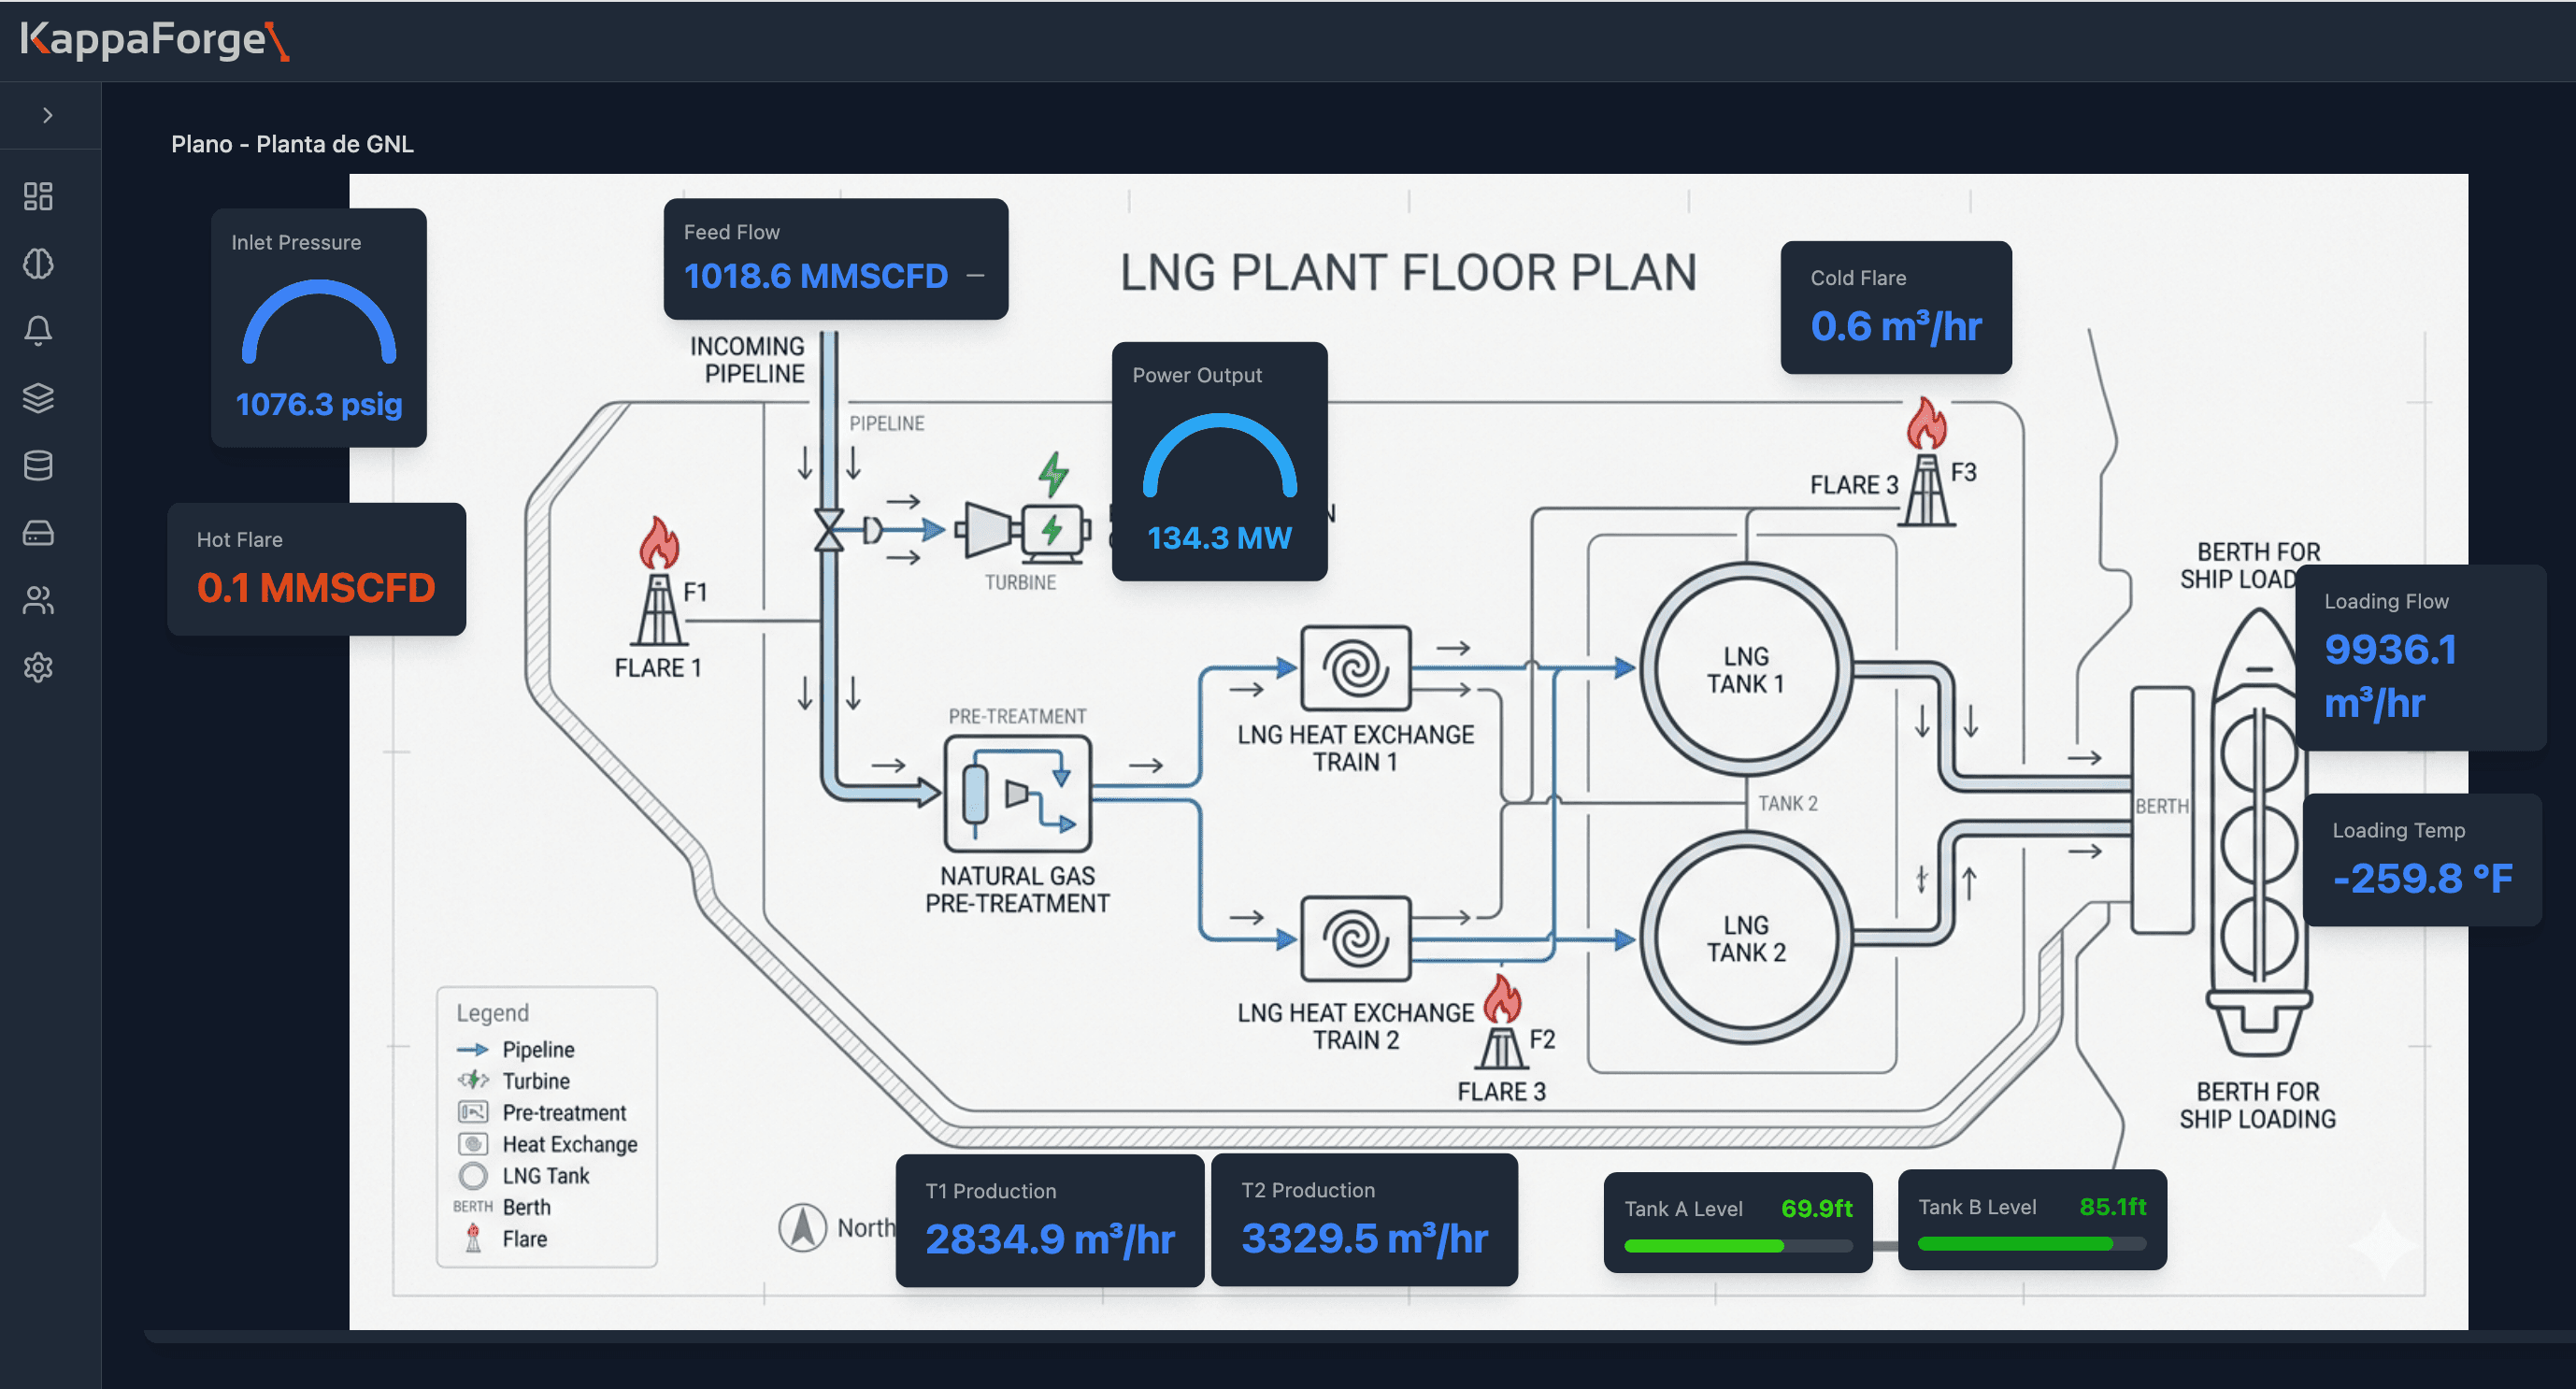
The plant, laid out
Readings sit on the real layout of the installation, in the physical place they are measured. Inlet pressure, production per train, tank levels and ship loading, on the same diagram operations already uses.
02
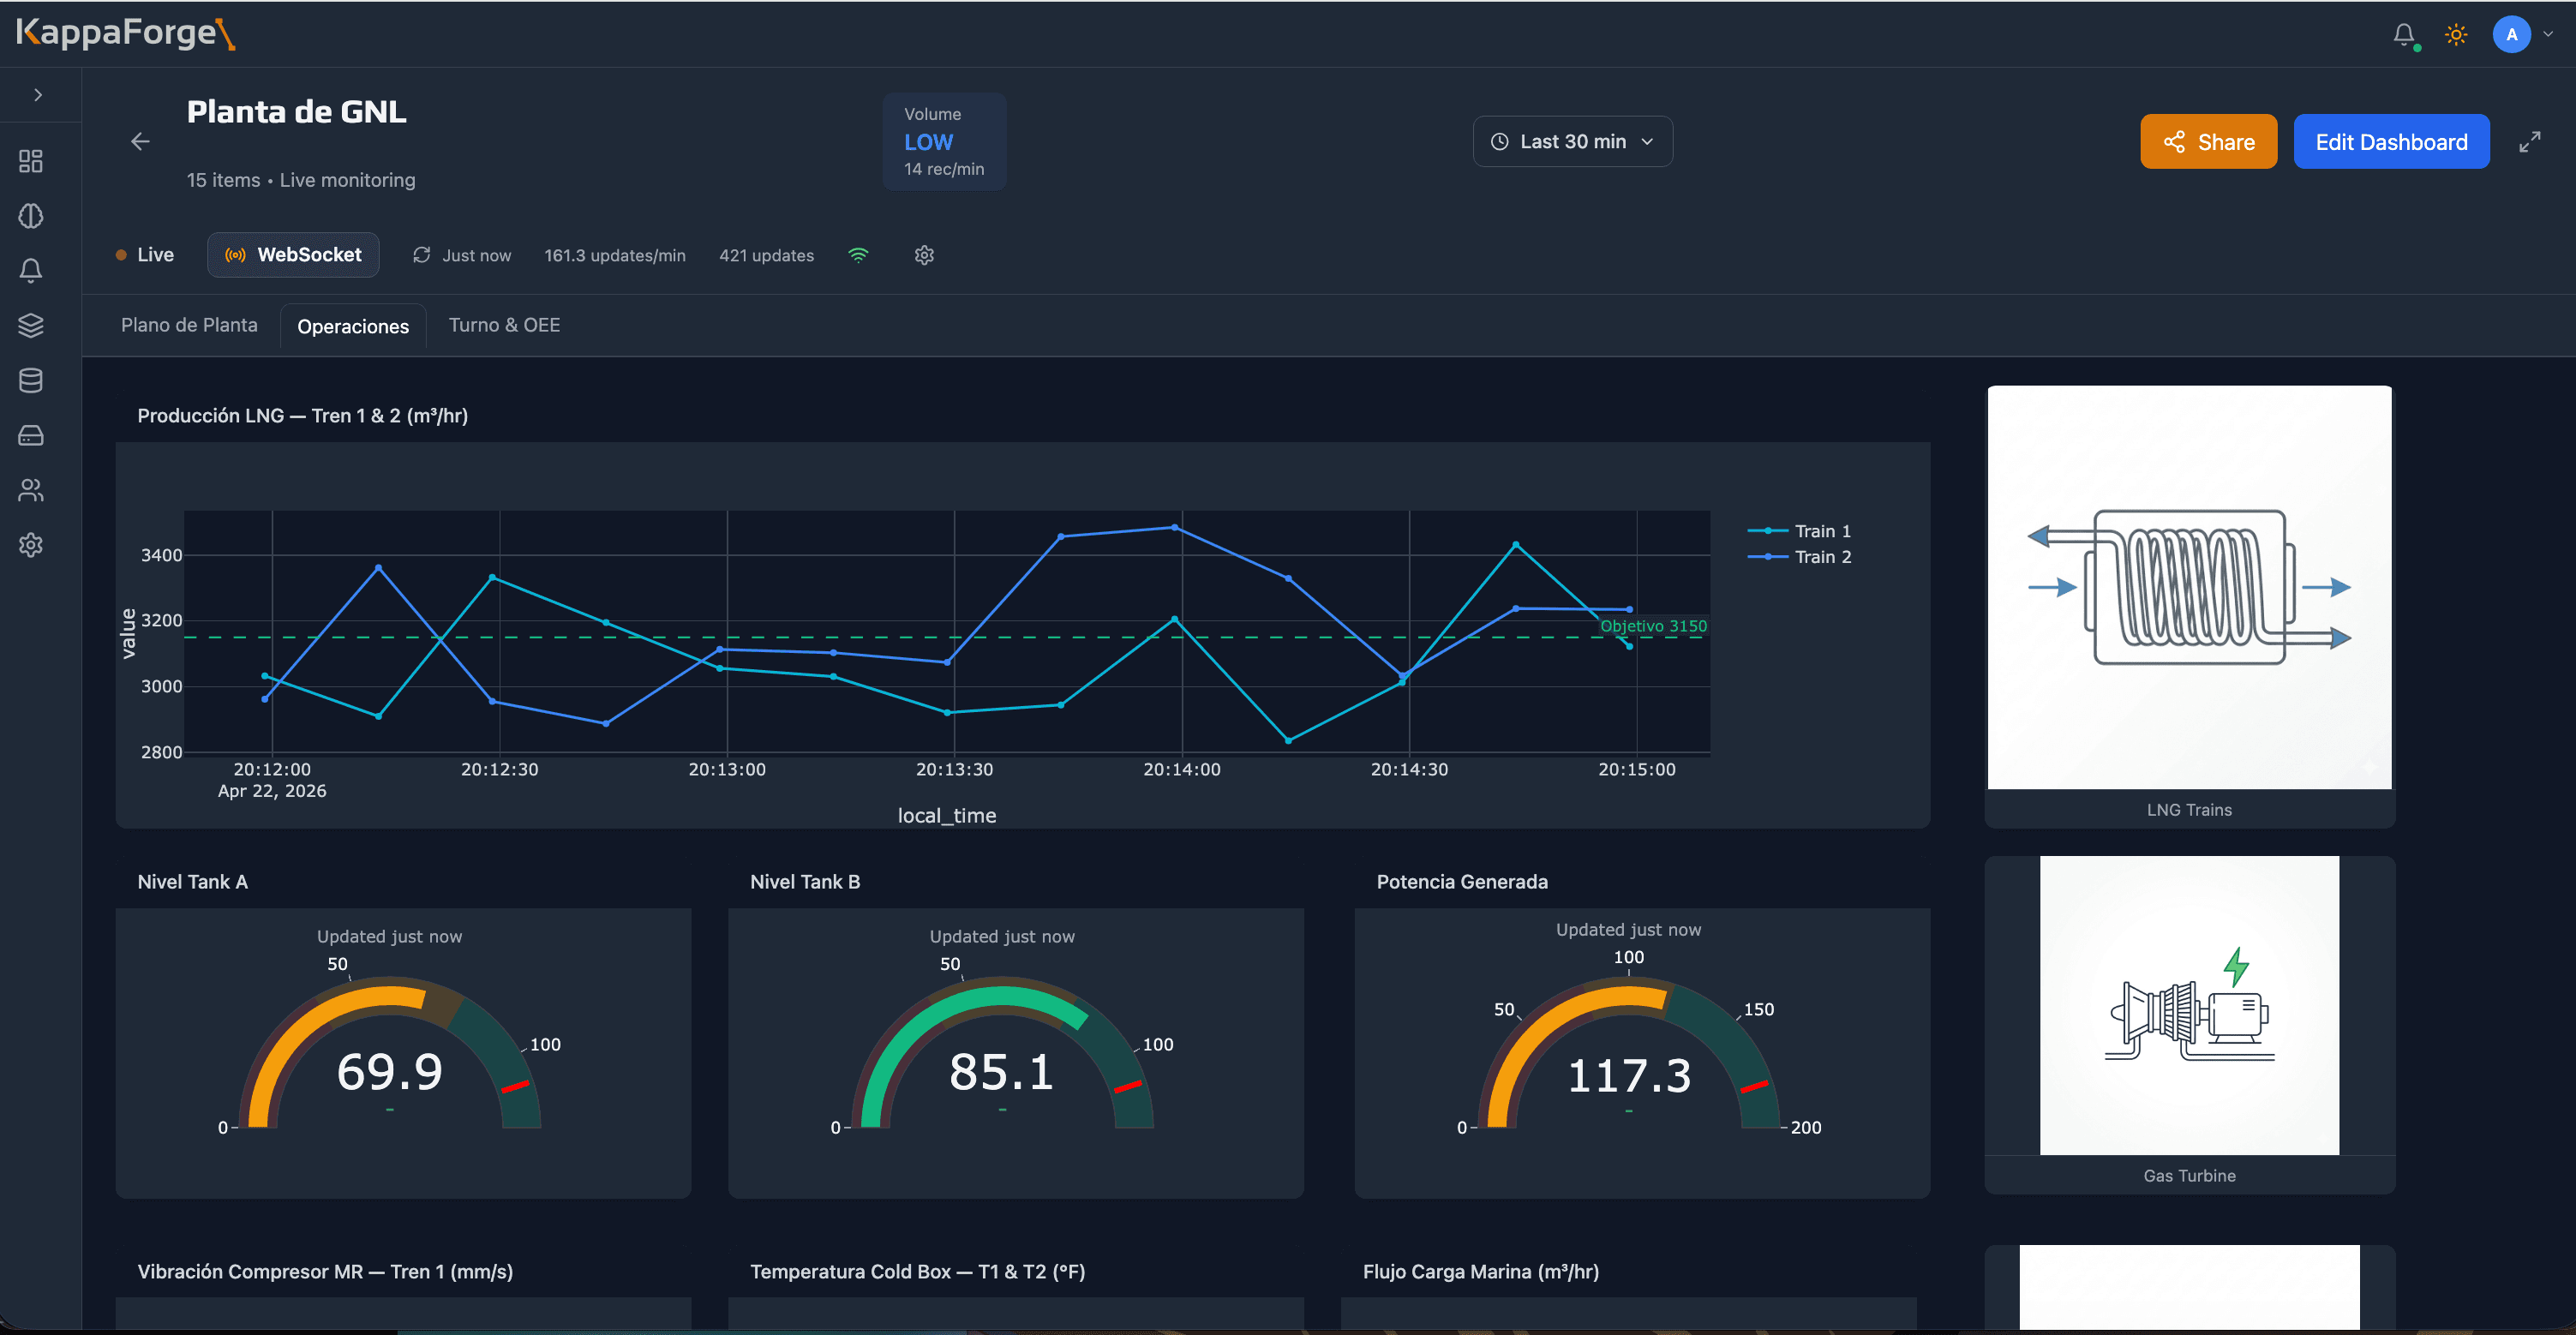
Trends against target
The same plant as a time series: both trains against the production target, levels, power generated and compressor vibration. Tabs separate what each shift needs to watch.
03
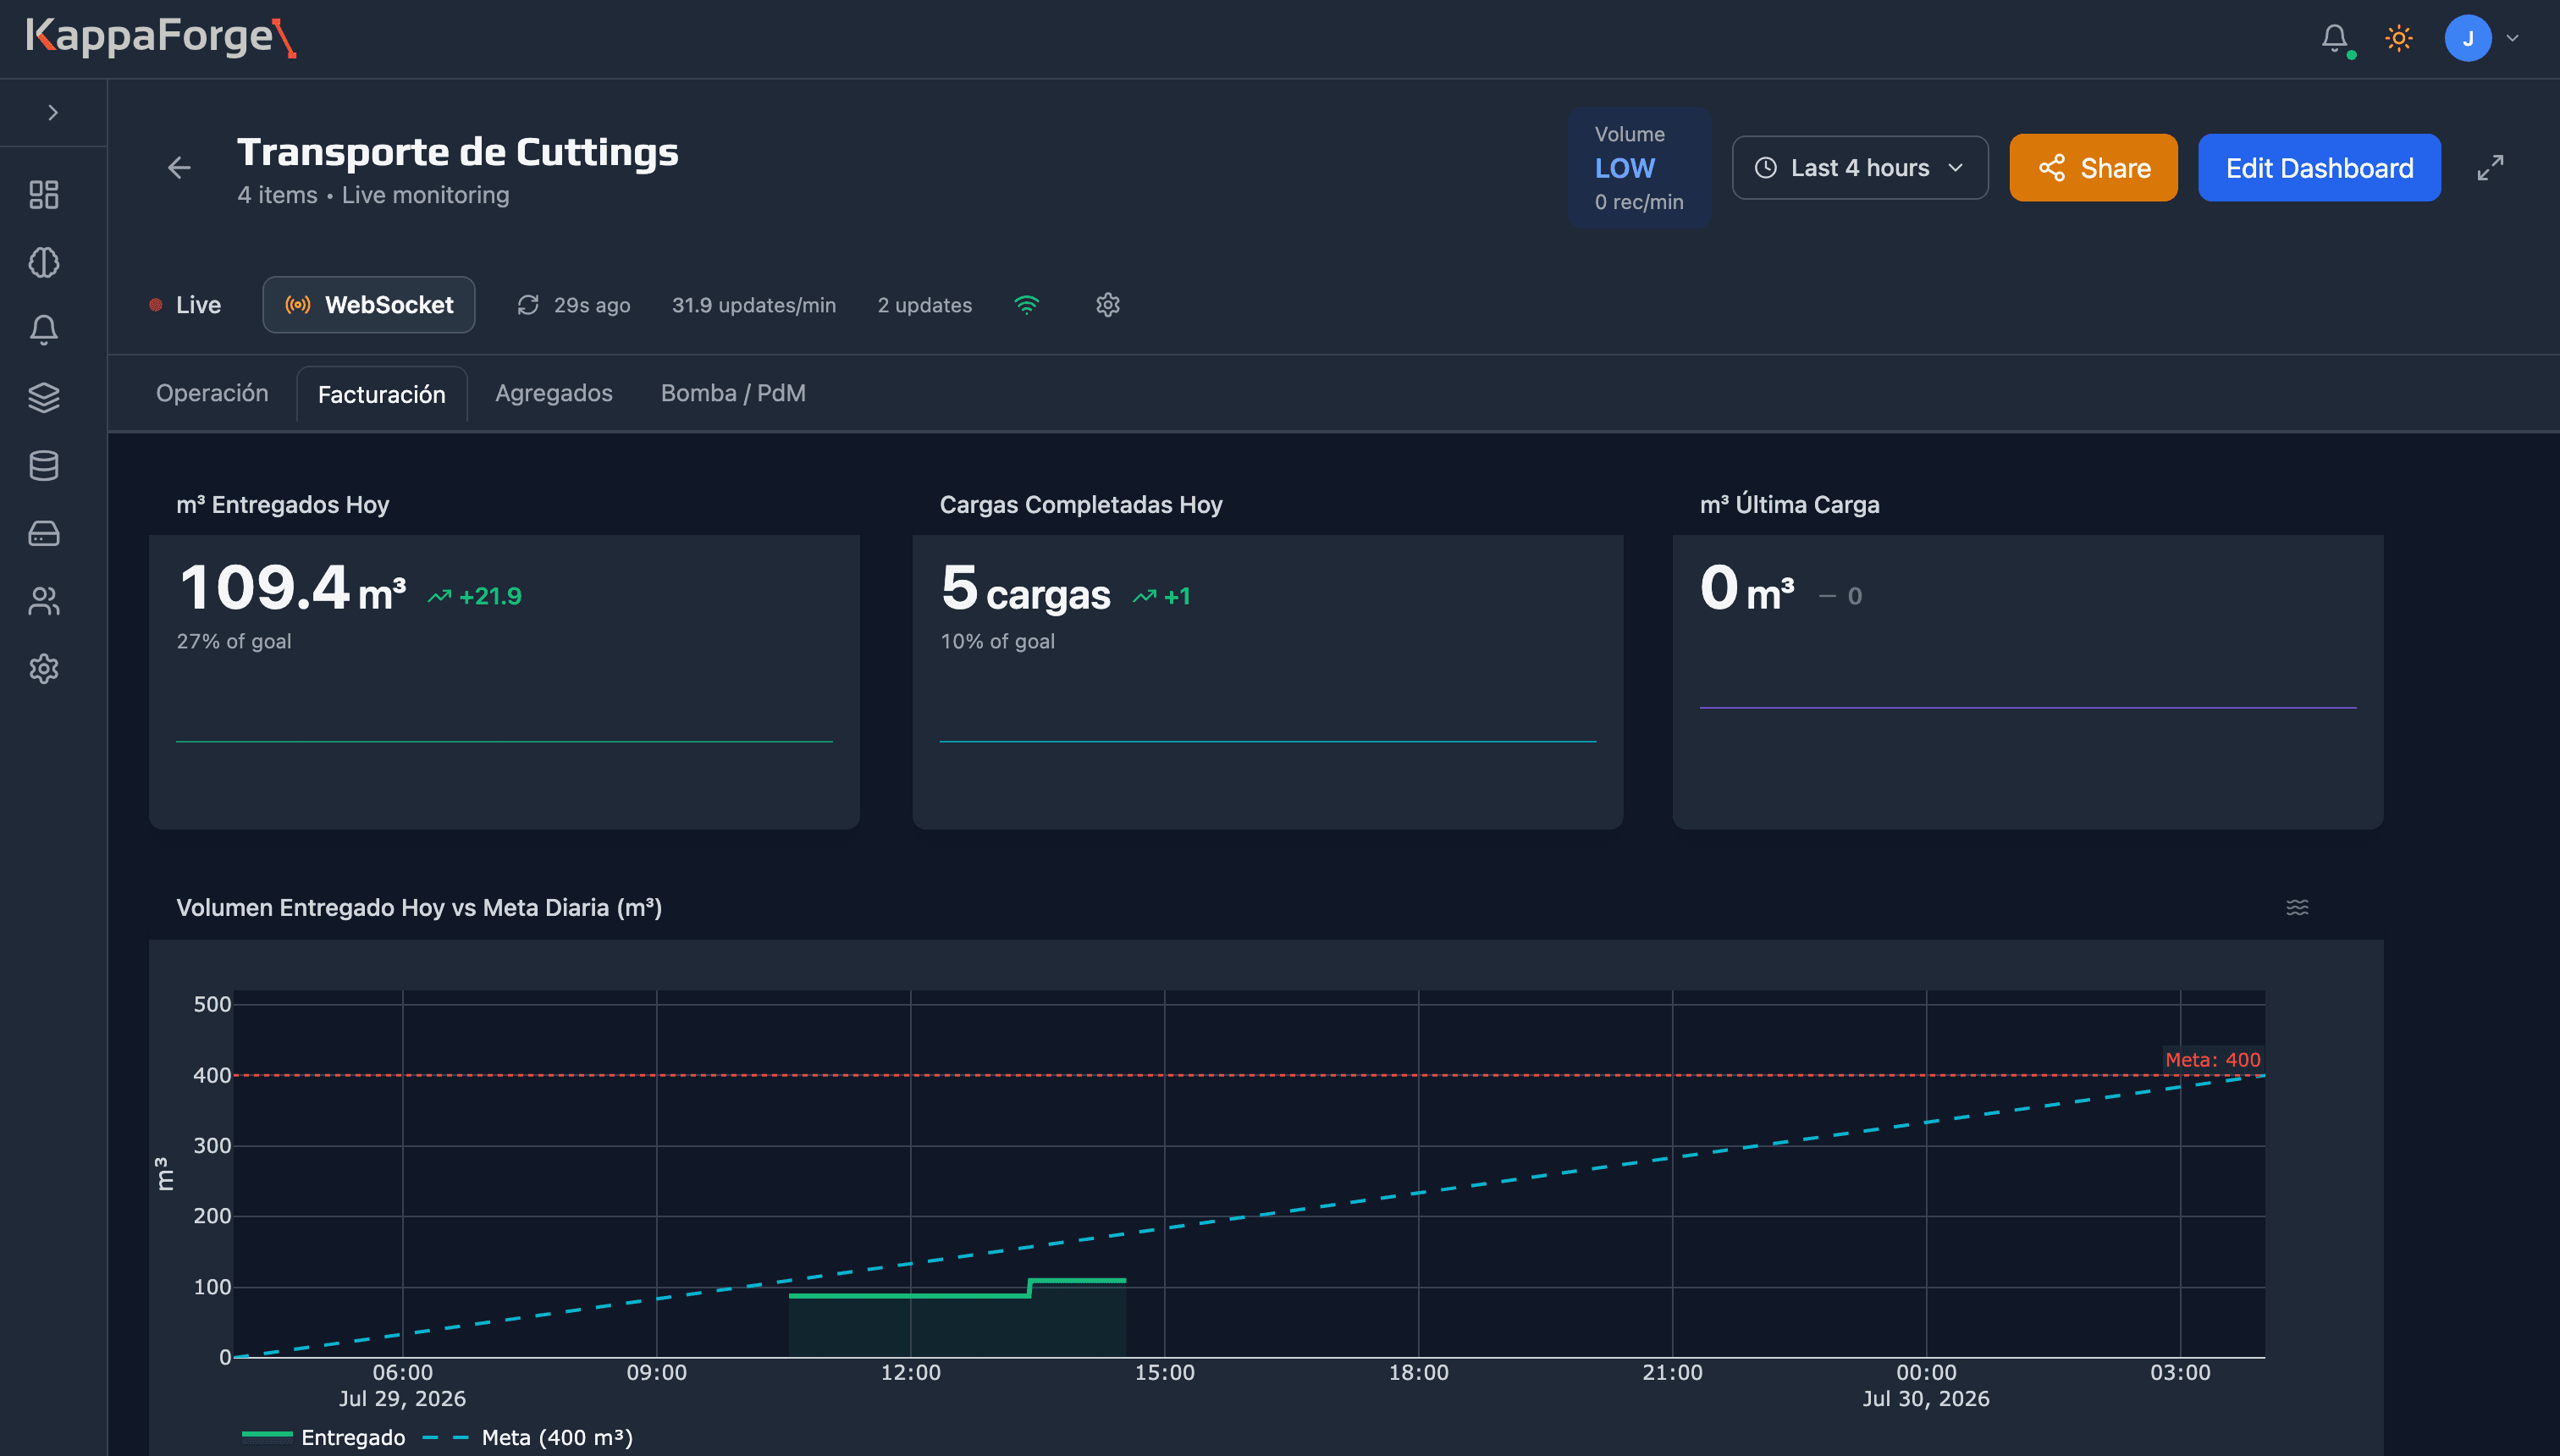
What gets billed today
Cuttings transport bills by cubic meter delivered, but the real volume of each vessel is only known once someone writes it down. Here the level sensor produces the figure directly.
04
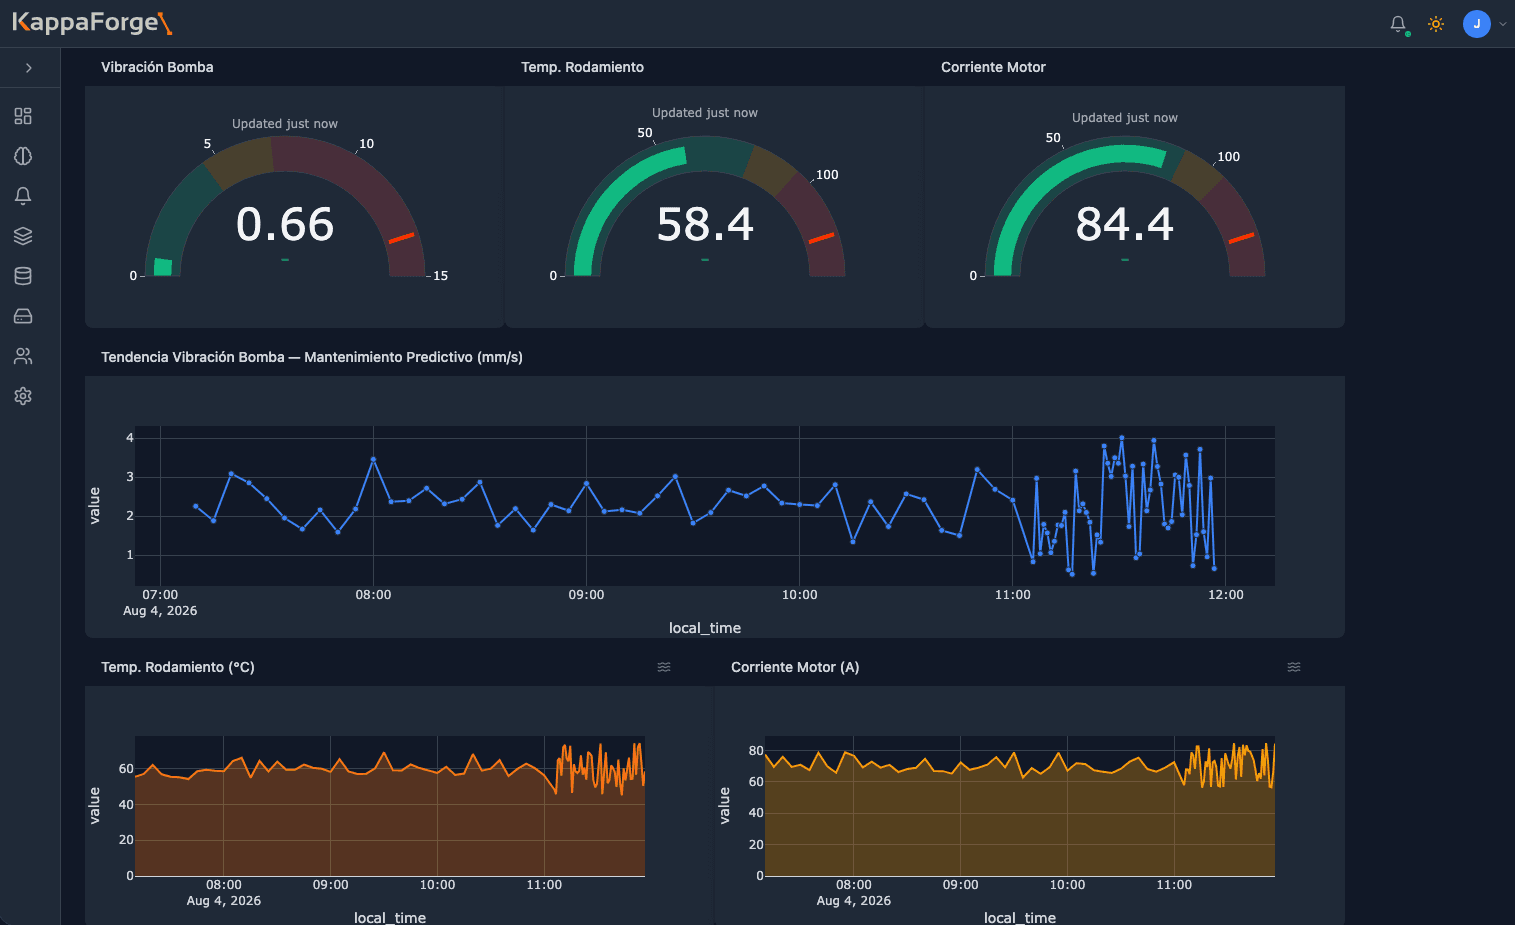
The pump warns before it stops
Vibration, bearing temperature and motor current, with the vibration trend for predictive maintenance. A pump failure stops the whole skid.
Models
What they learn from the same data.
Operating ranges compare against normal running. The forecasting model projects operations forward. The root-cause model reconstructs backwards to find the bottleneck. Together they give you the operational picture of the plant.
Operating ranges
They learn how each machine normally moves from its own history, then flag the drift when a signal leaves that band. The comparison runs continuously against current behavior.
Root cause
After an event, it traces backwards through where the problem propagated to find the origin and what to do about it.
What the model says
Equipment is running within expectations.
11 of 11 sensors inside their range.
The daily target is met, but only just.
Projected 402 m³ against a target of 400. One load short and it misses.
Pump vibration is turning erratic.
Up 1.4 mm/s in two hours without reaching the limit. Worth checking at the next planned stop.
Each alert names the signal it came from and the calculation used.
Forecasting targets and failures
They anticipate a target that will be missed or a failure before the signal reaches its limit. The band widens with the horizon: the further out the projection, the less precise the number and the more honest it is to show a range.
Pricing
Plans
Prices vary based on compute needs. Instrumentation is quoted per installation.
Real-time
From USD 1,000/mo
Real-time features, no AI. Compute limits apply.
Pro
From USD 2,400/mo
Dedicated tenant, more compute, AI included.
Enterprise
Contact us/mo
Multiple sites or dedicated compute. Scoped per deployment.
Instrumentation
Quoted
Sensors and PLC work. Varies with plant size, equipment count and labor.
Next step